Writing Task 1
Read the task below, then type your answer in the panel on the right.
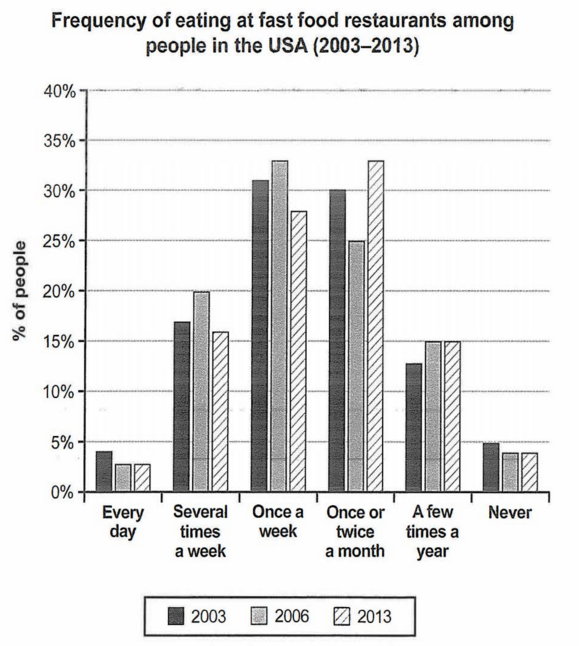
WRITING TASK 1 You should spend about 20 minutes on this task. The chart below shows how frequently people in the USA ate in fast food restaurants between 2003 and 2013. Summarise the information by selecting and reporting the main features, and make comparisons where relevant. Write at least 150 words.
Words: 0